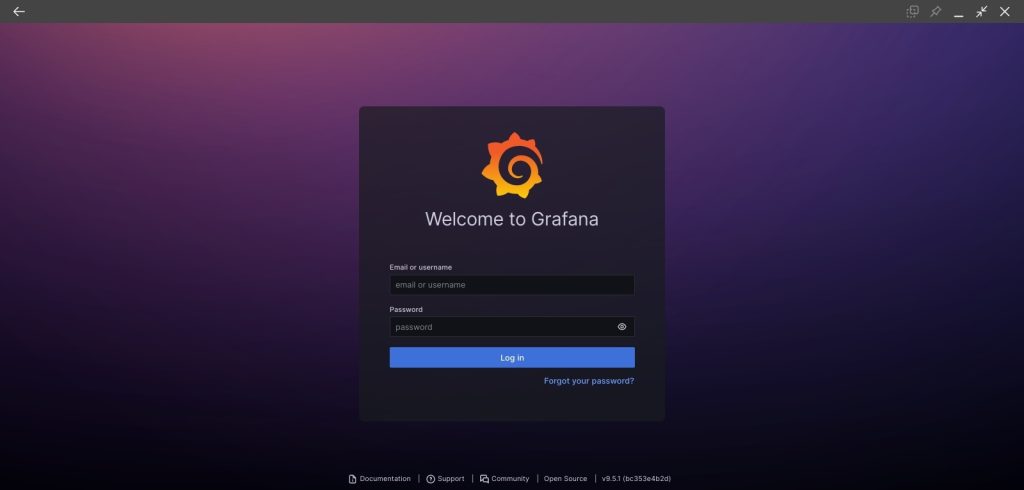
Monitor Proxmox with Telegraf, InfluxDB, and Grafana
Grafana has always been on the top of my learning list ever since it was introduced to me in 2018. I was just a user back then and never really had the chance to configure a monitoring stack along with it. Proxmox already has its own dashboard showing sufficient information, but since I would need to be monitoring multiple systems at once, then I feel like this is the perfect time to start learning Grafana....