Grafana has always been on the top of my learning list ever since it was introduced to me in 2018. I was just a user back then and never really had the chance to configure a monitoring stack along with it.
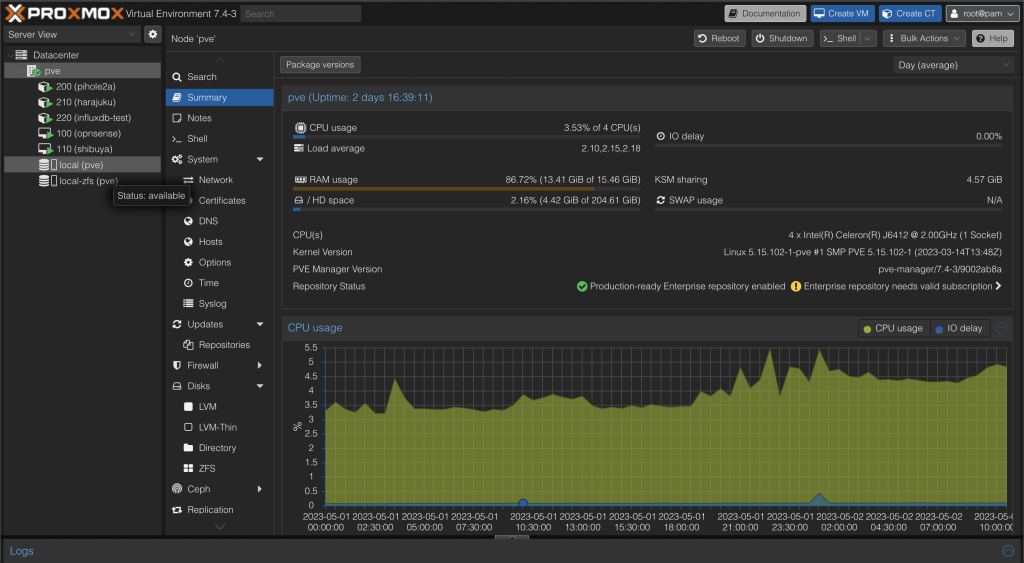
Proxmox already has its own dashboard showing sufficient information, but since I would need to be monitoring multiple systems at once, then I feel like this is the perfect time to start learning Grafana.
I will not go into detail since I myself still need to go through more on the documentation, but here I will walk you through how to get InfluxDB (for storing metrics), and Grafana up and running with Proxmox in the simplest way possible. Taking another mile we are also going to install Telegraf on the Proxmox host to send additional data (e.g. CPU core temperature) which is not monitored and sent by Proxmox by default.
I will be running both InfluxDB and Grafana as two separate containers on my main server. If you are not using Unraid as your docker manager but something else like Portainer, the same steps should still be applicable on high level. As for Telegraf it will be running inside an LXC container on my PVE host.
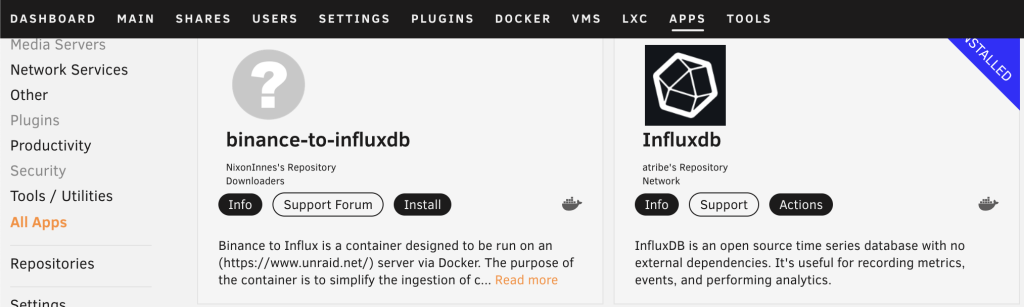
Install InfluxDB
You can install the latest version of InfluxDB2. On Unraid you can get the one from atribe’s repository.
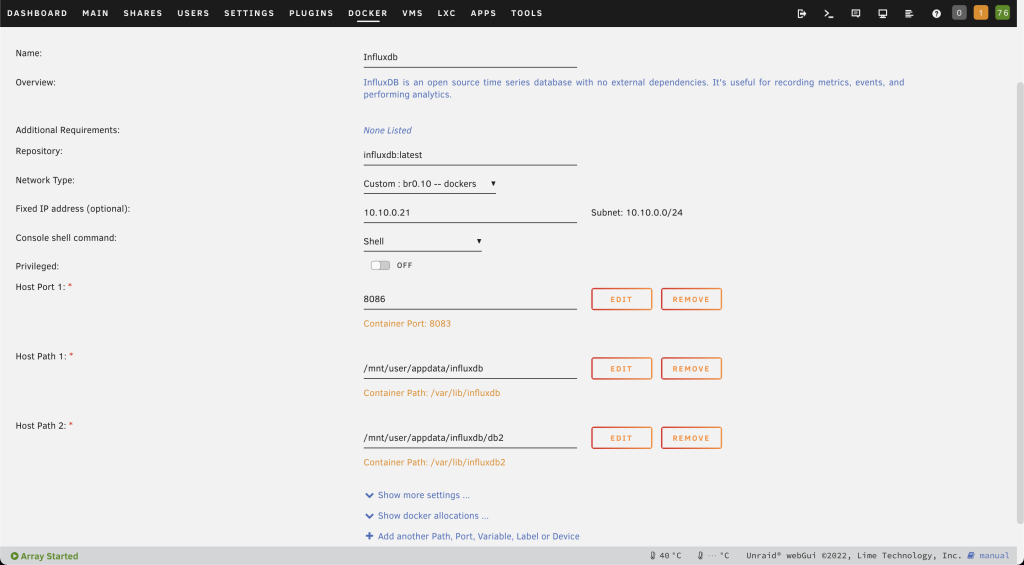
You will need to assign a static IP so your endpoints will send to a single destination. You can select the bridge and assign a unique IP in the same subnet as your host, or as a better option, run your docker containers on a separate vlan. Delete the second host port and leave 8086 exposed. Everything else in default.
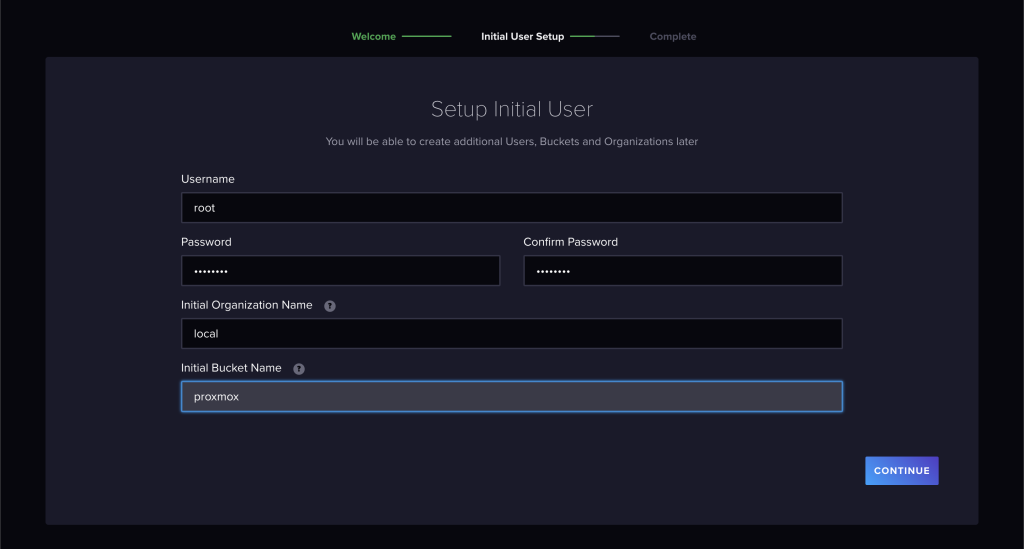
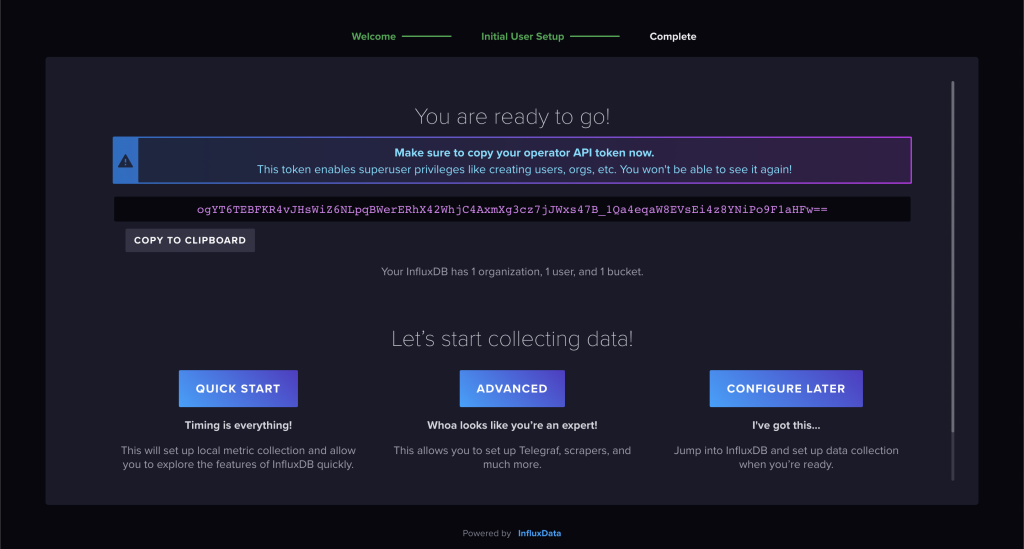
Open the InfluxDB WebUI. Create a username, assign an organization name and a bucket name.
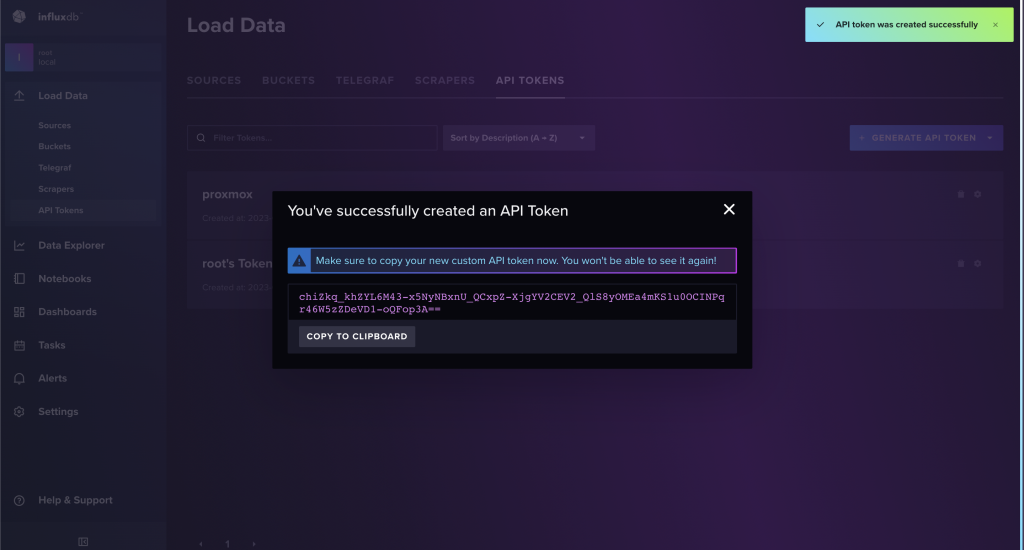
On the next screen take note of your token. You can use this token later on or you can generate a new one.
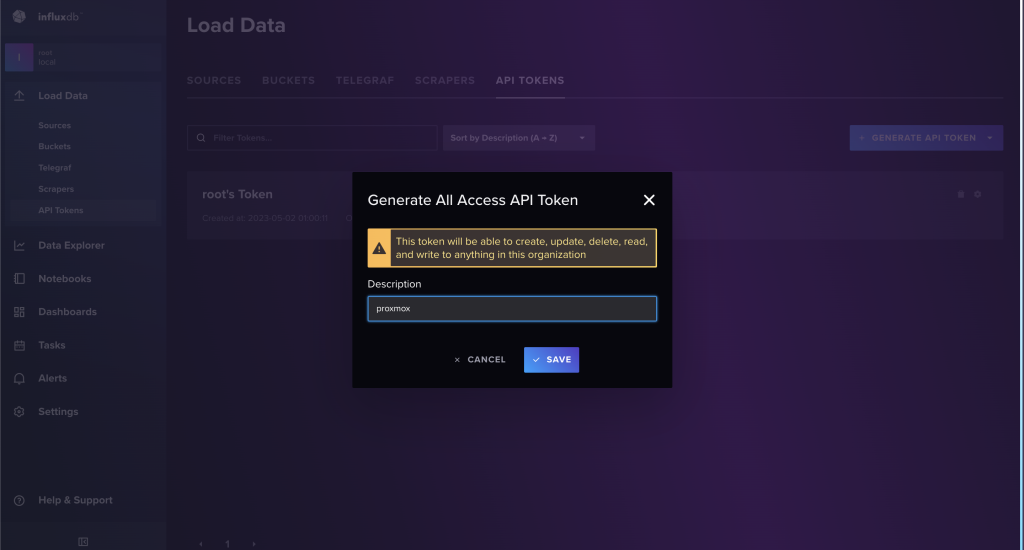
To generate a new token, go to Data > API > Generate API token. Add a description and save.
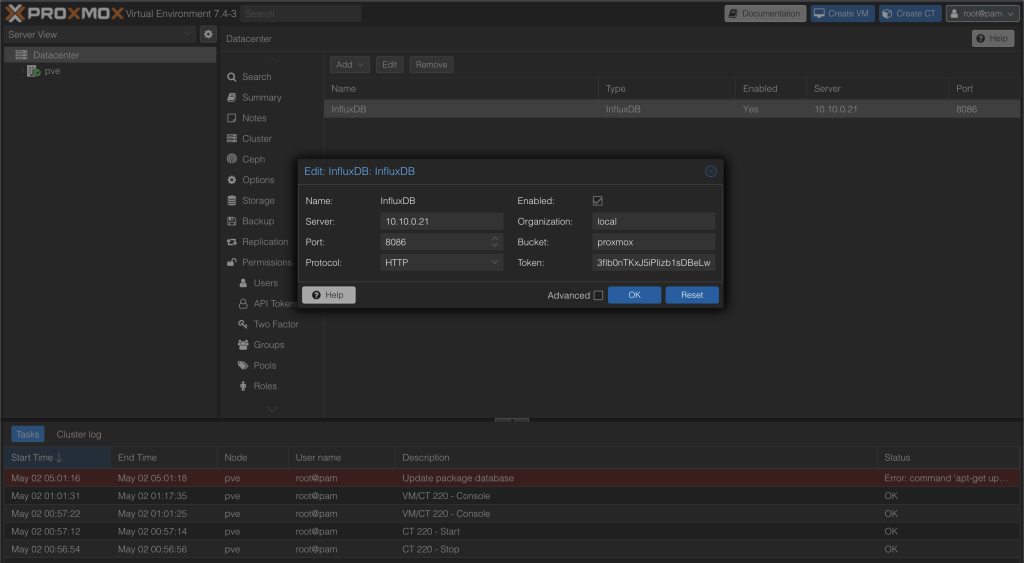
Go to Proxmox > Datacenter > Metrics > Add > InfluxDB. Input the same information during user creation and the token created for proxmox. Input the InfluxDB IP and port 8086 in the server field.
Install Grafana
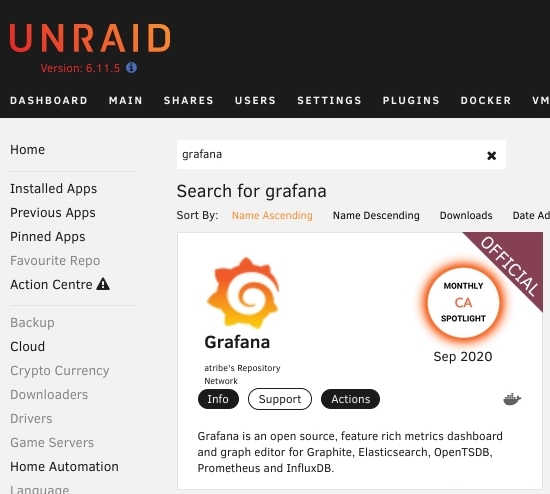
Install the official Grafana docker.
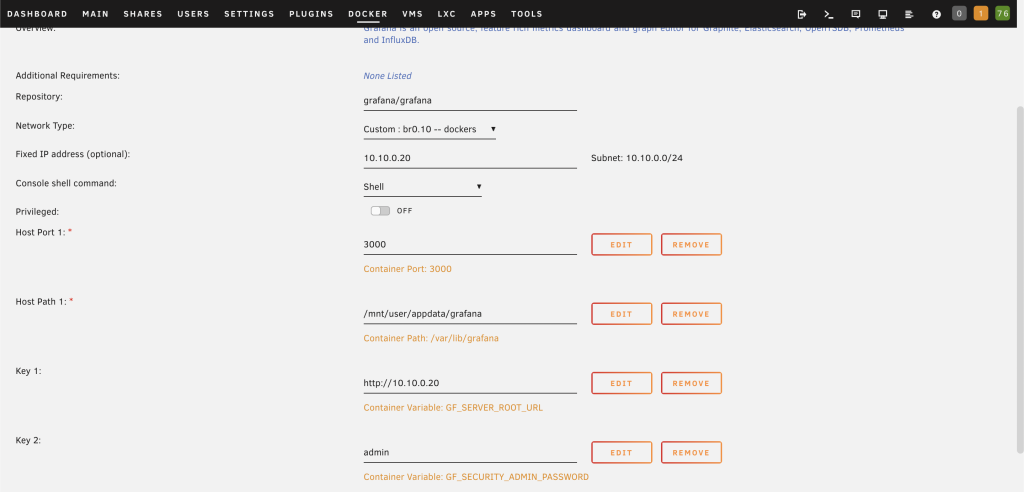
Assign a unique IP and an admin password. The server URL should also have the IP address. Leave default port of 3000.
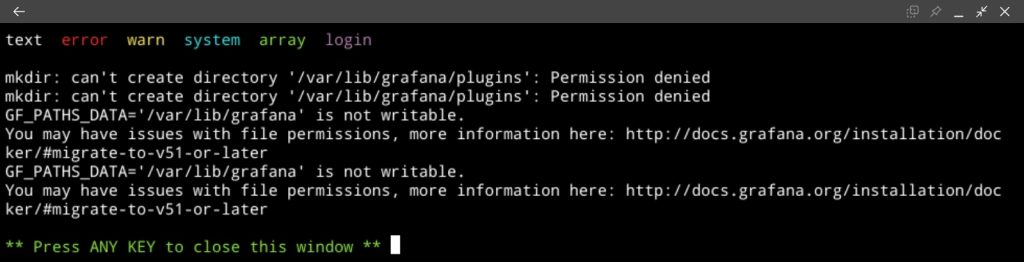
On Unraid if you go to the dockers tab, you will see that Grafana is not running and. If you check logs it will show some permission error.
Open the terminal and go to /mnt/user/appdata. Check the permissions of the grafana directory. Enable the write permission on group and others level.
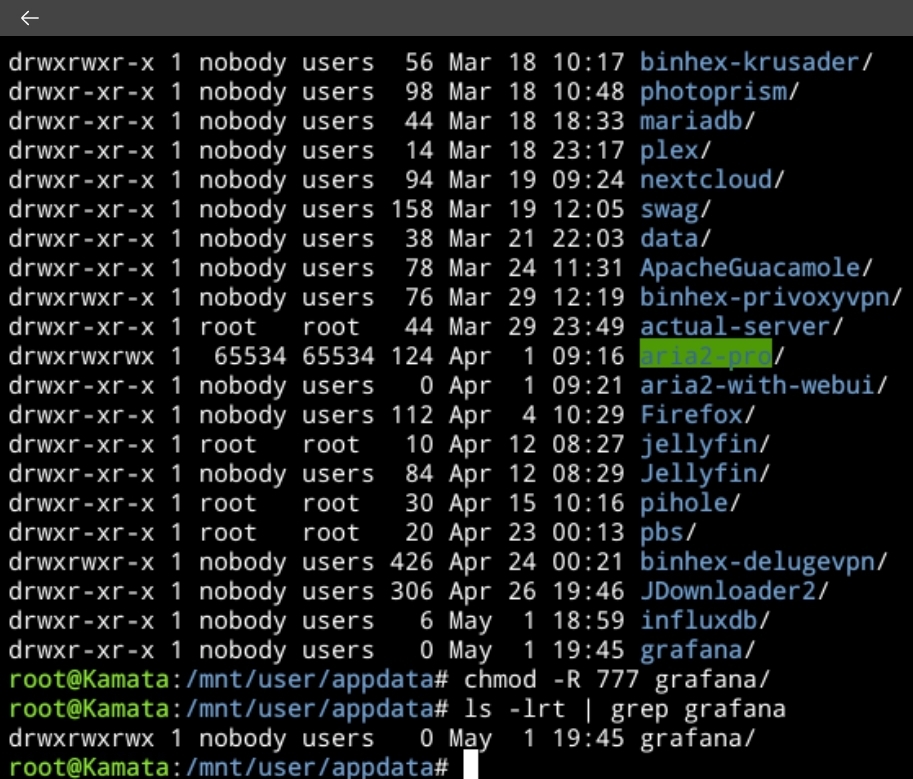
ls -lrt /mnt/user/appdata | grep grafana
chmod -R 777 /mnt/user/appdata/grafana
Restart Grafana and enter the WebUI. You can go to http://<grafana_ip>:3000.
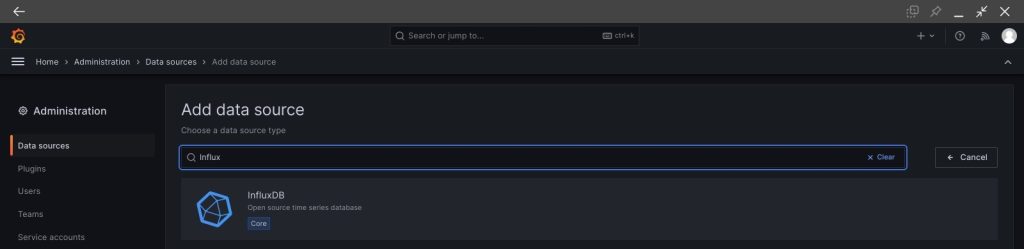
Go to Administration > Data sources > Add data source. Search InfluxDB.
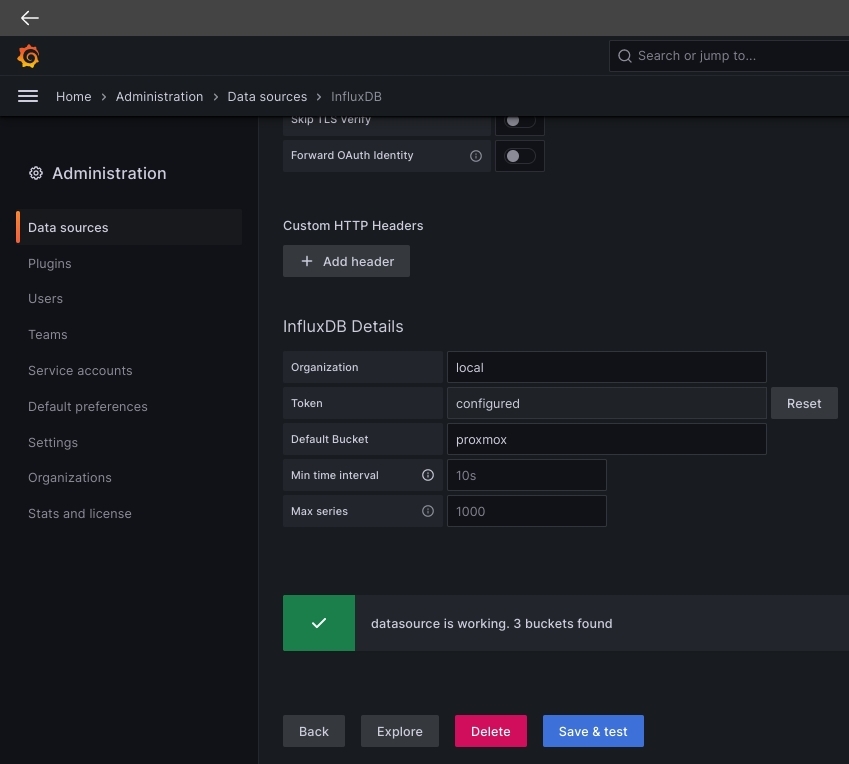
Set query language to Flux. Basic auth should be disabled. Enter InfluxDB URL and port.
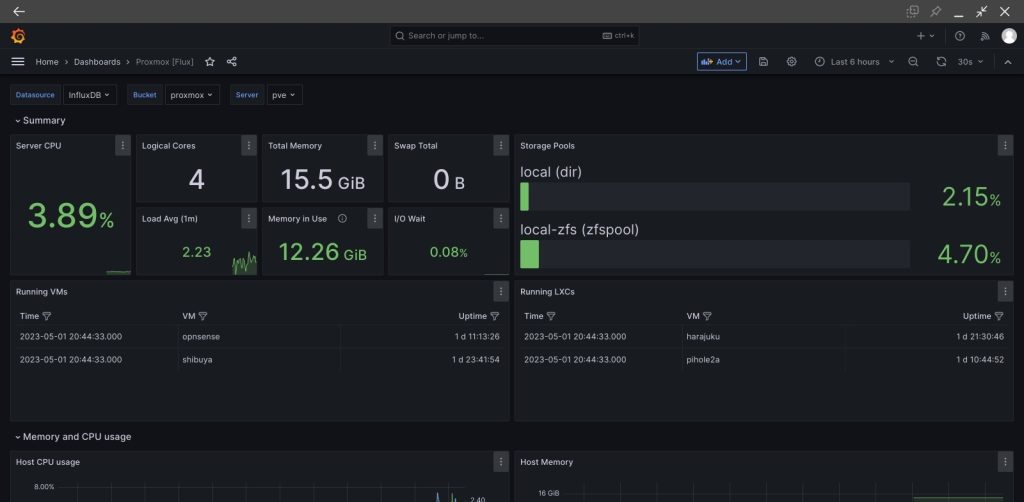
Next thing to do is to import a dashboard created by one community member (mephisto). This is one of the good things about Grafana. Since it’s widely used by many, we can also get a plenty ton of different pre-created dashboards shared by the community members in the Grafana dashboard repository. For more information on the dashboard we will be importing, you can find it here. Don’t forget to throw in some stars!
Go to Dashboards > New > Import > Import via grafana.com > 15356 (Note that 15356 is the dashboard ID at this time of writing but it can change. It’s still best to go to the link and copy the ID from there.) Select the proxmox datasource. Select the proxmox bucket. You can then save this dashboard.
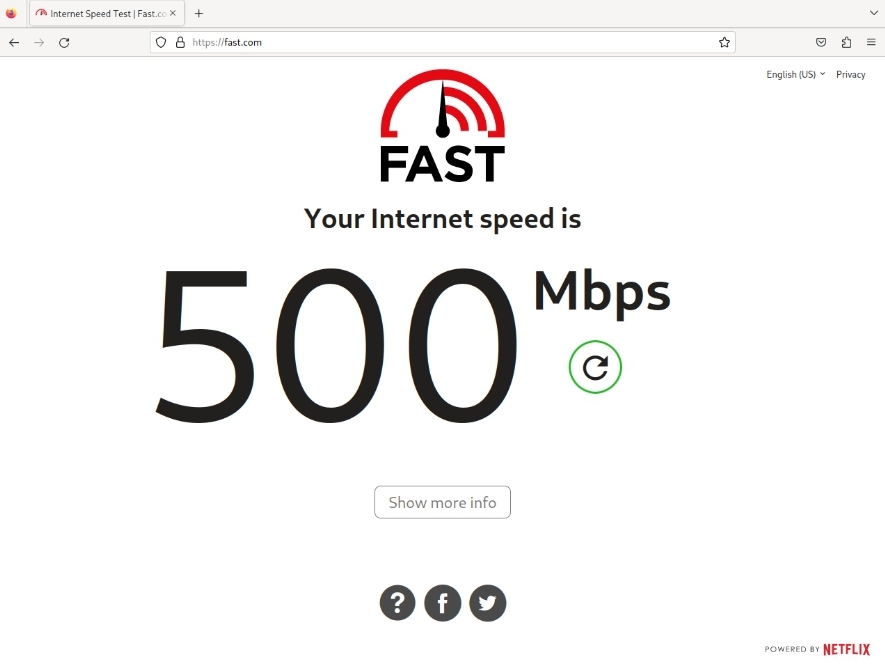
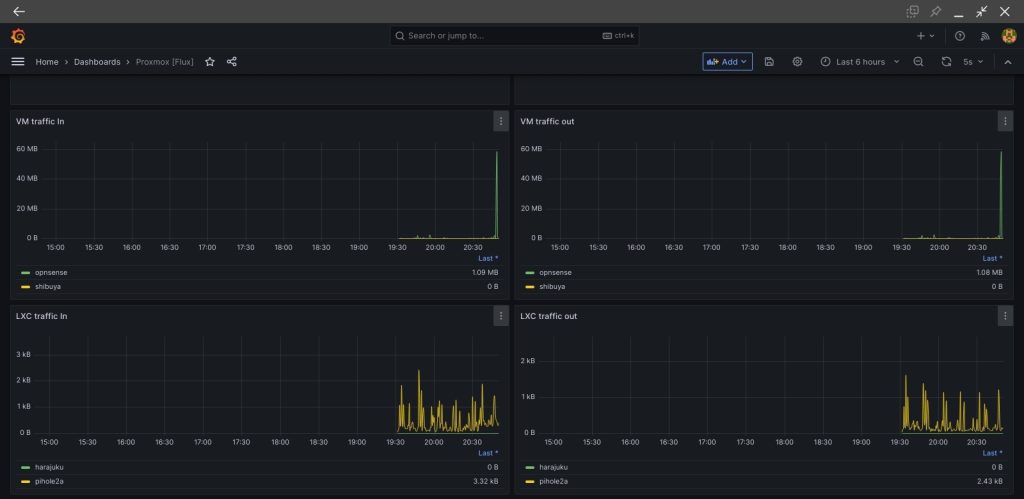
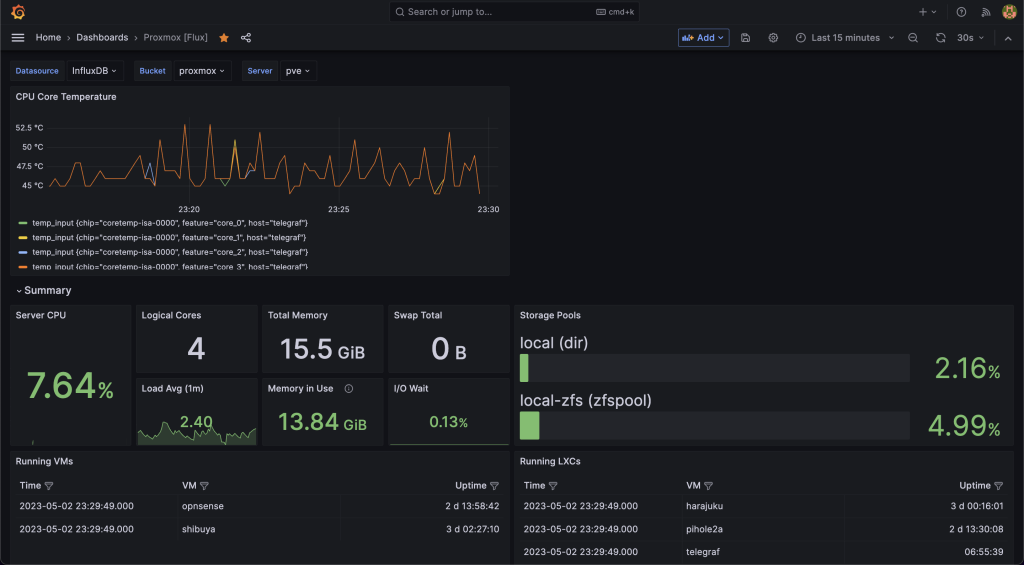
Testing real time metrics. You can do a speed test and see if it will show increase in I/O in Grafana.
Now we have InfluxDB and Grafana working with Proxmox. Do note that this doesn’t include the CPU temperature. It’s not included in the Proxmox dashboard either. To get this to show in Grafana we will need to install a package called lm-sensors and install Telegraf – a backend service that will push temperature metrics to InfluxDB.
Install Telegraf and lm-sensors
Telegraf can send the default linux metrics but this doesn’t include the CPU core temps. We need to install the lm-sensors package for this. We will run it on an LXC container as a safer practice.
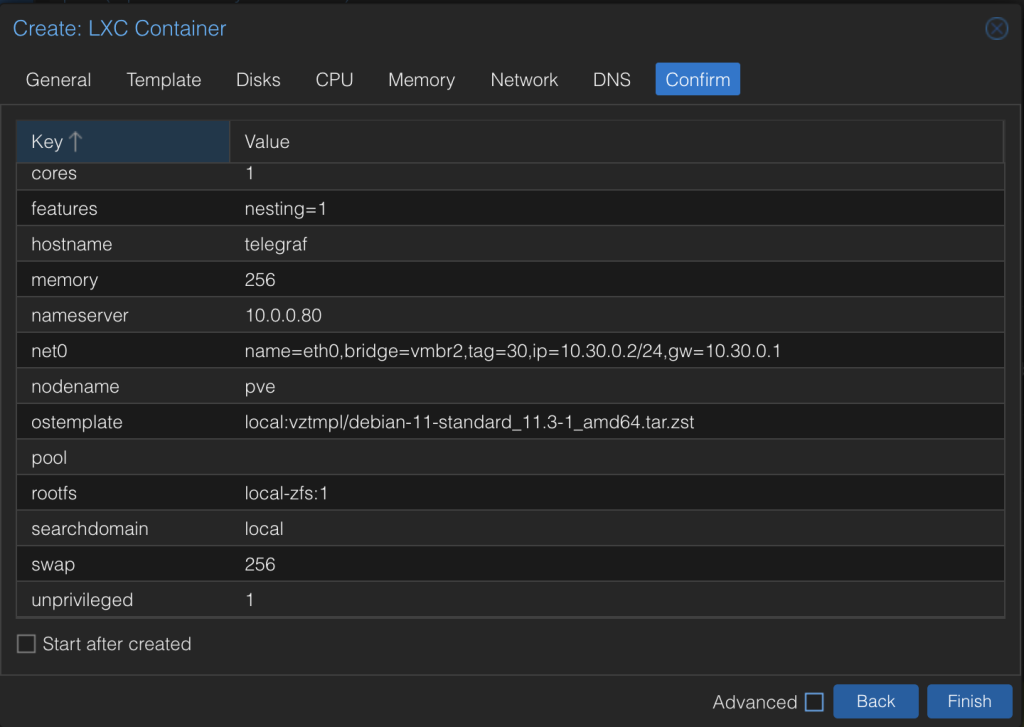
Crate a new container. 256MB of RAM should be sufficient. Don’t mind the CPU core count set to 1 since the lm-sensors tool will still be able to monitor the physical cores attached to the host.
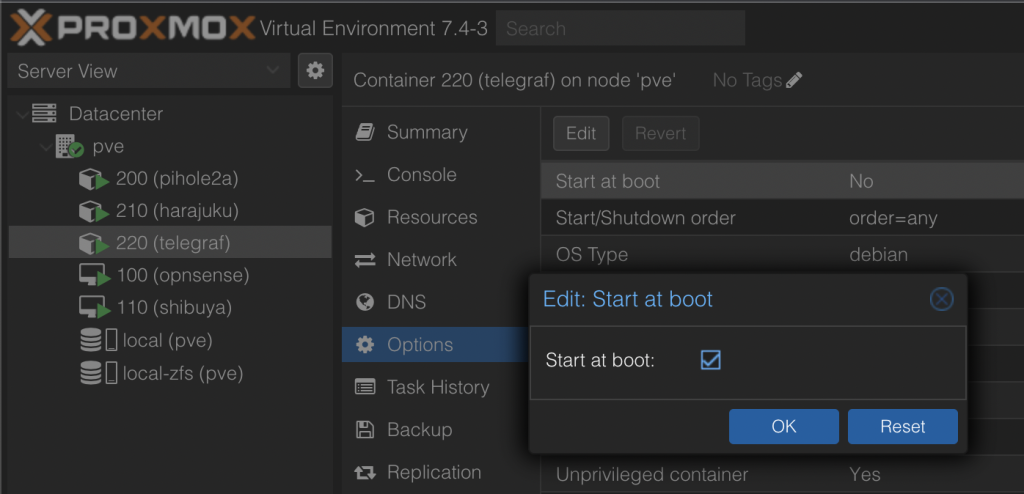
Enable start at boot.
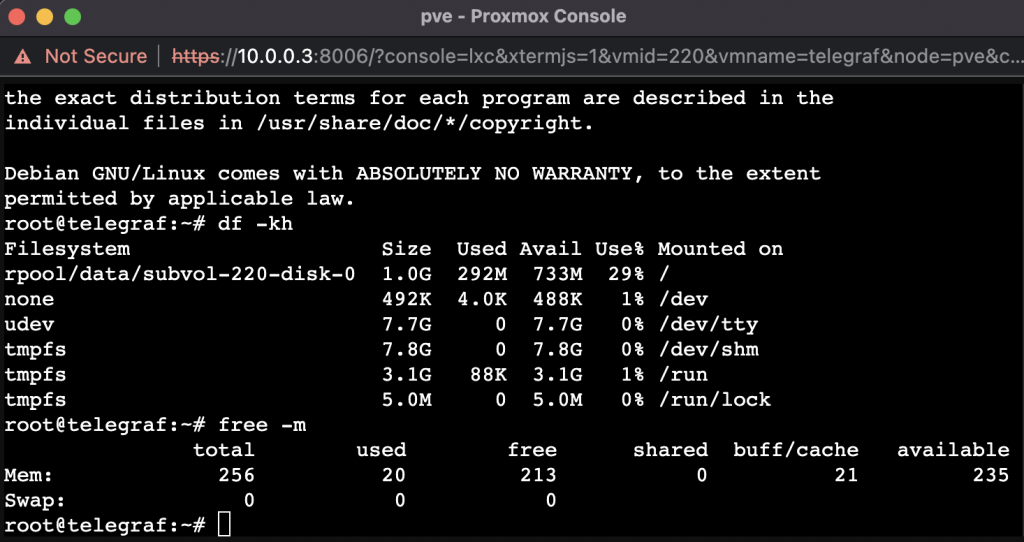
Do necessary checks post creation. Always check the disk and memory after container creation and before doing any change. Knowing the initial state of a system will always save you time and effort in the long run once issues arise.
Update and upgrade packages. Install lm-sensors.
apt-get update -y && apt-get upgrade -y
apt-get install -y lm-sensors
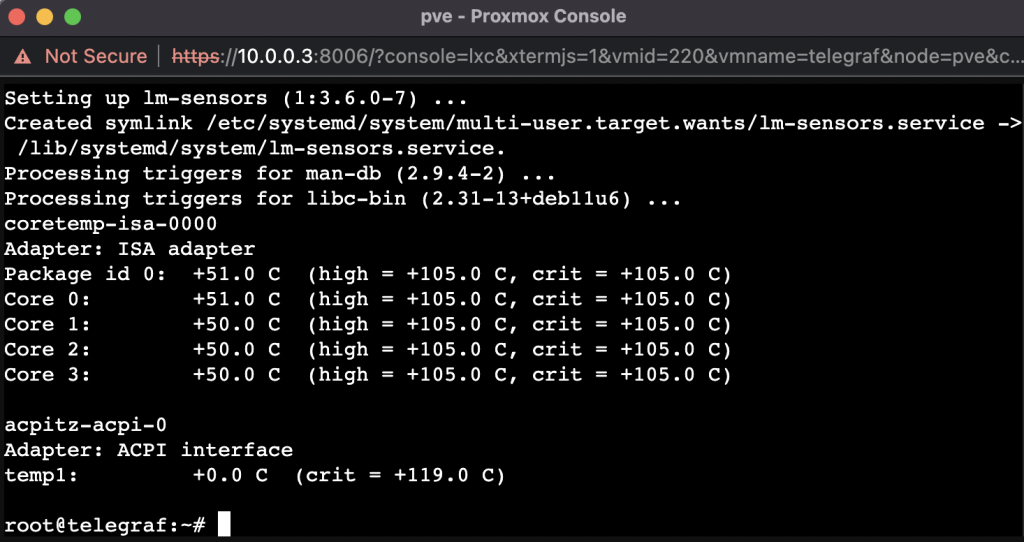
sensors
The last command will output the current temperature for each physical core.
Checking the Influx documentation we can install telegraf with the following commands. As a pre-requisite we need to install the commands wget, gpg, and sudo. Installing sudo is optional since we are running as root but we’ll add it anyway.
apt-get install -y wget gpg sudo

# influxdata-archive_compat.key GPG fingerprint:
#     9D53 9D90 D332 8DC7 D6C8 D3B9 D8FF 8E1F 7DF8 B07E
wget -q https://repos.influxdata.com/influxdata-archive_compat.key
echo '393e8779c89ac8d958f81f942f9ad7fb82a25e133faddaf92e15b16e6ac9ce4c influxdata-archive_compat.key' | sha256sum -c && cat influxdata-archive_compat.key | gpg --dearmor | sudo tee /etc/apt/trusted.gpg.d/influxdata-archive_compat.gpg > /dev/null
echo 'deb [signed-by=/etc/apt/trusted.gpg.d/influxdata-archive_compat.gpg] https://repos.influxdata.com/debian stable main' | sudo tee /etc/apt/sources.list.d/influxdata.list

sudo apt-get update && sudo apt-get install telegraf
Have a quick check on the disk utilization to ensure you have sufficient space.
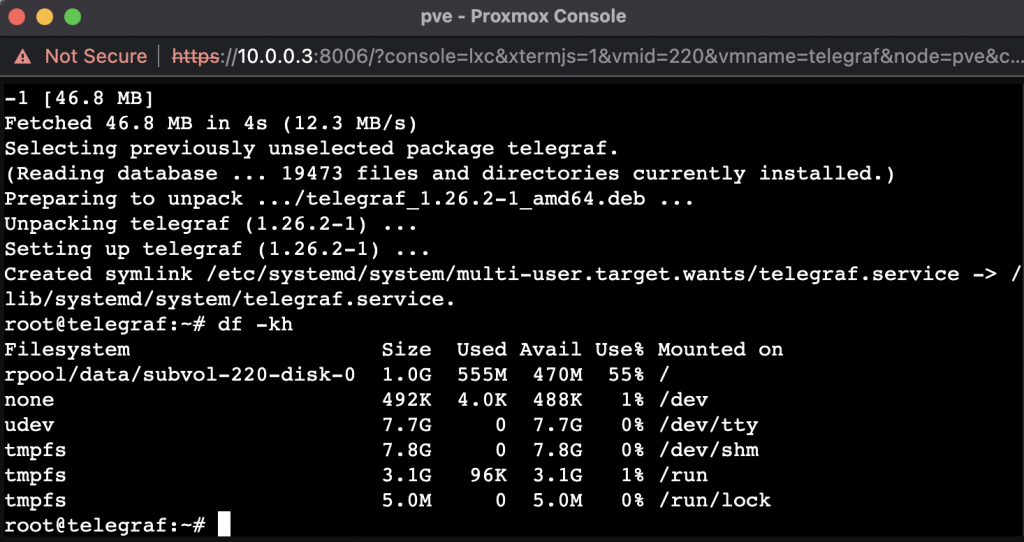
At this point we still have above 55% remaining. This should be enough!
Checking metrics to be sent by default:
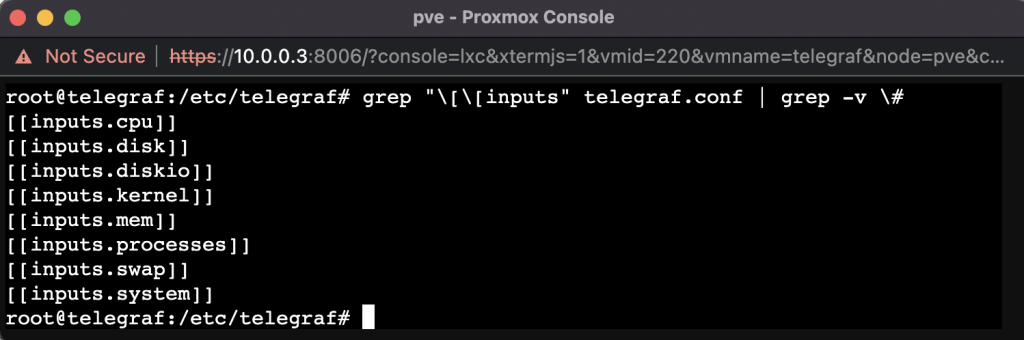
grep "\[\[inputs" telegraf.conf | grep -v \#
This will show the uncommented plugins. If we keep the config like this then Telegraf will also send these metrics to InfluxDB.
For now we just want the core temperatures. We have to comment everything and uncomment the [[inputs.sensors]] plugin. First, backup original configuration file.
mkdir ~/backup
cp /etc/telegraf/telegraf.conf ~/backup/telegraf.conf
Now you have the option to use the telegraf.conf I uploaded here or you can do it manually.
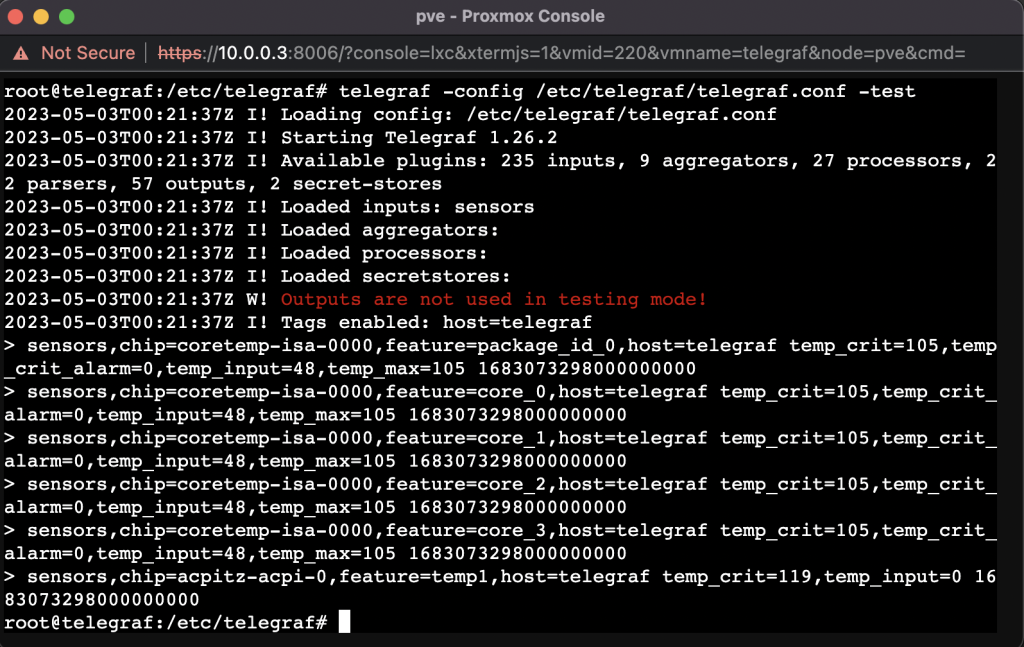
Once that is done Initiate a dry-run to verify the metrics that will be sent with the updated config file.
telegraf -config telegraf.conf -test
You can also copy paste the content of this telegraf.conf file which has the above steps implemented.
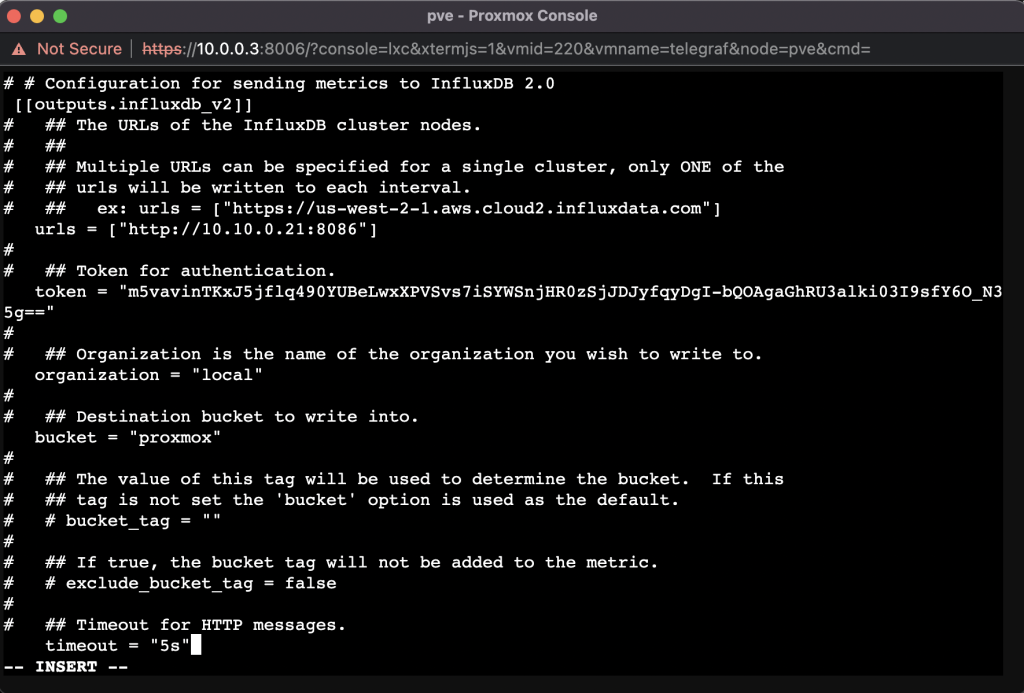
Next is to input the InfluxDB details. Uncomment the following lines
[[outputs.influxdb_v2]]
urls
tokens
organization
bucket
timeout
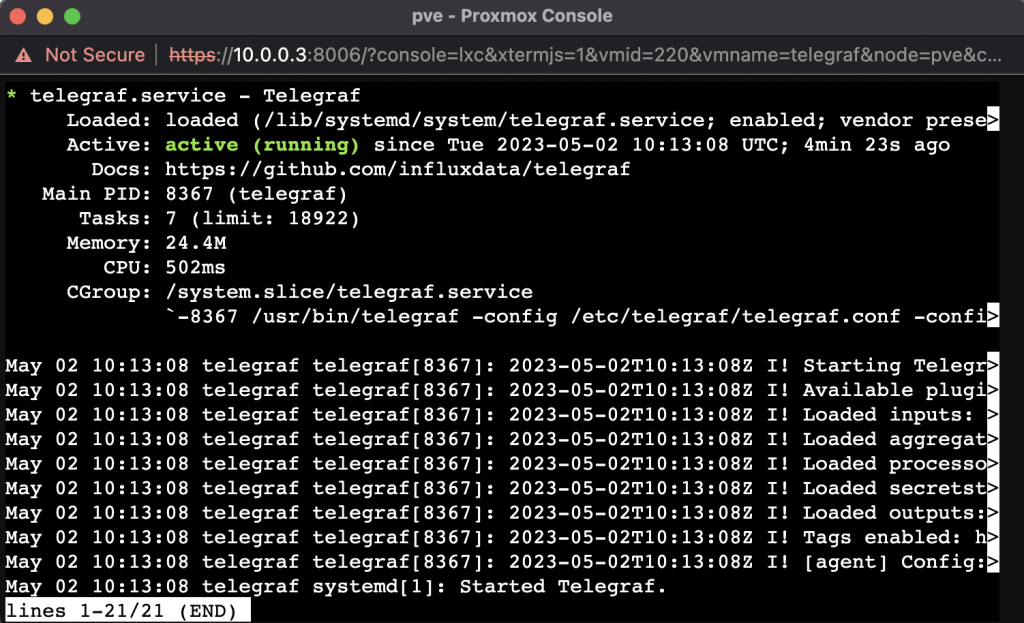
Start and enable telegraf. Verify the status after a few seconds.
systemctl start telegraf
systemctl enable telegraf
systemctl status telegraf
Go back to InfluxDB > Data Explorer. From here you can create a query with the help of the script editor and by selecting the metrics you want to be sent.
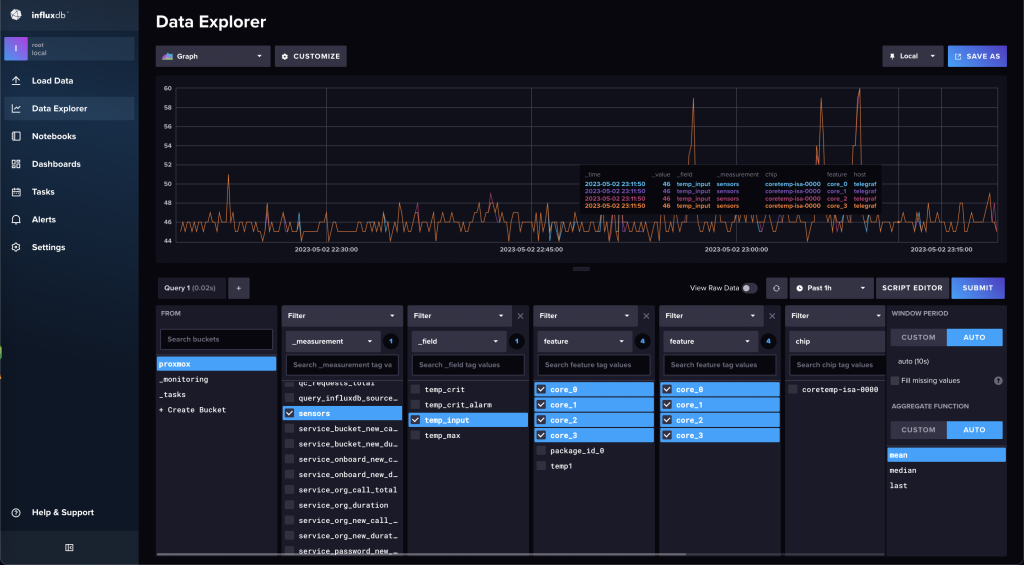
If you don’t want to do this you can just copy the Flux query shared below. You might want to add more to the four CPU core counts already included. Do note that I am using an Intel processor and it might not work if you are using AMD. If for any reason it doesn’t work for you, then I would suggest creating the query manually in InfluxDB.
from(bucket: "proxmox")
  |> range(start: v.timeRangeStart, stop: v.timeRangeStop)
  |> filter(fn: (r) => r["_measurement"] == "sensors")
  |> filter(fn: (r) => r["_field"] == "temp_input")
  |> filter(fn: (r) => r["feature"] == "core_0" or r["feature"] == "core_1" or r["feature"] == "core_2" or r["feature"] == "core_3")
  |> filter(fn: (r) => r["feature"] == "core_0" or r["feature"] == "core_1" or r["feature"] == "core_2" or r["feature"] == "core_3")
  |> aggregateWindow(every: v.windowPeriod, fn: mean, createEmpty: false)
  |> yield(name: "mean")
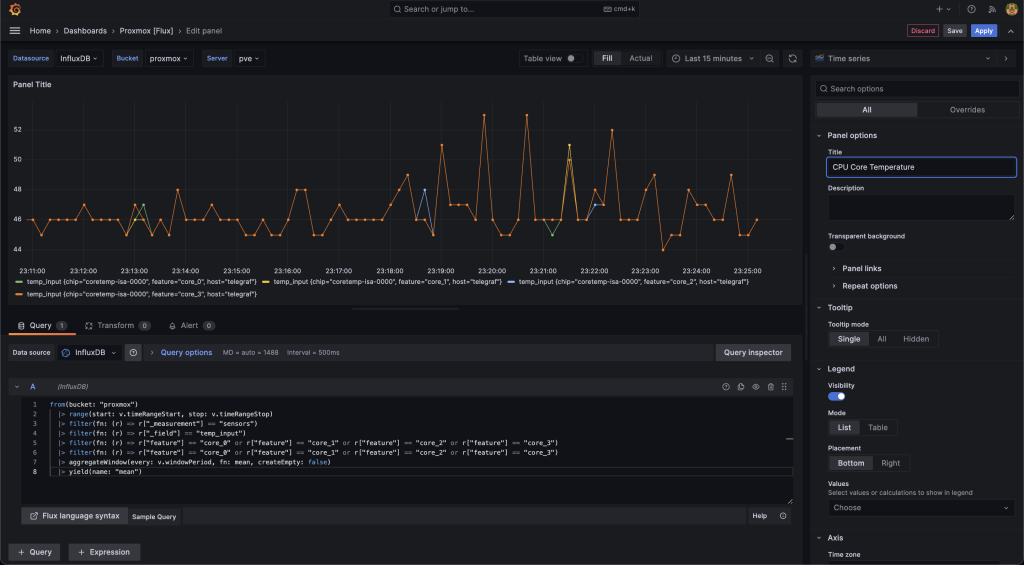
Go back to the Grafana dashboard and add a new visualization. Paste the Flux query at the bottom panel. Assign the panel title and the units in celsius.
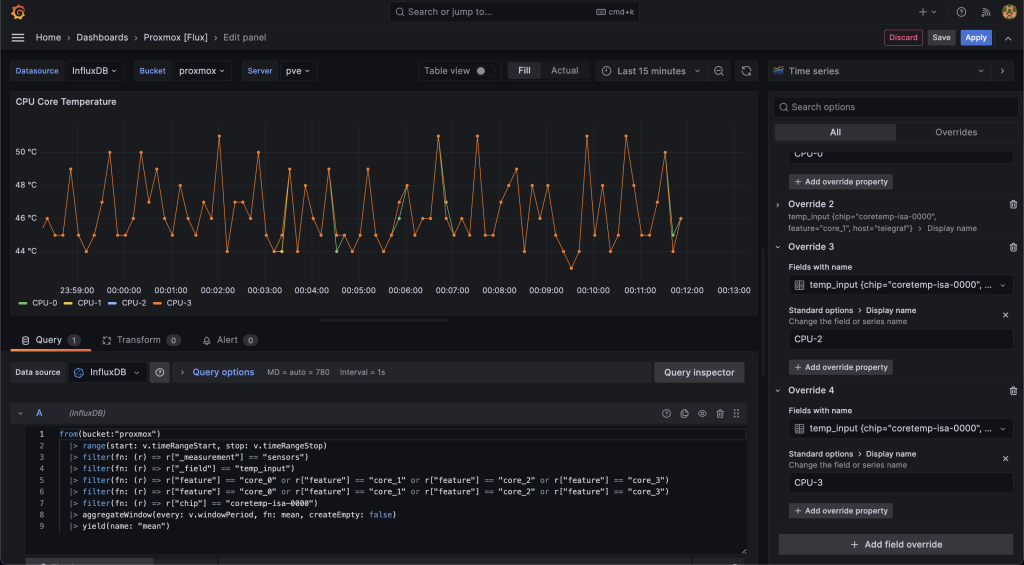
If the legend labels are too long, you can make use of the override options to create change the display name. Add field override > Fields with name. Add override property > Standard options > Display name.
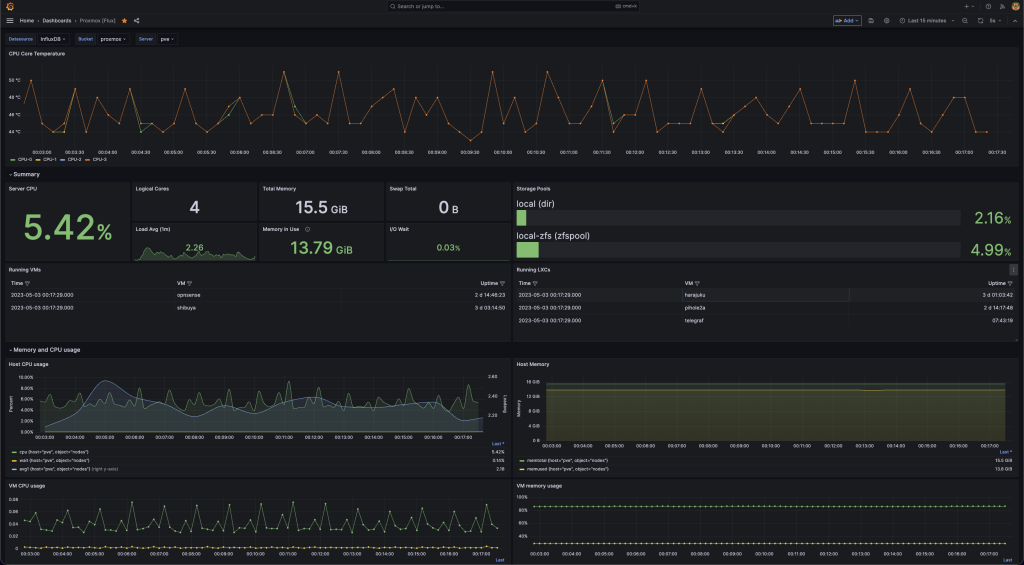
You now have complete TIG stack running for Proxmox! The same steps can be followed for other platforms and if in case they don’t have any built-in function to send metrics to InfluxDB, you can just install Telegraf instead.